Crosstabs
Get real-time data access from the minute your study is set live.
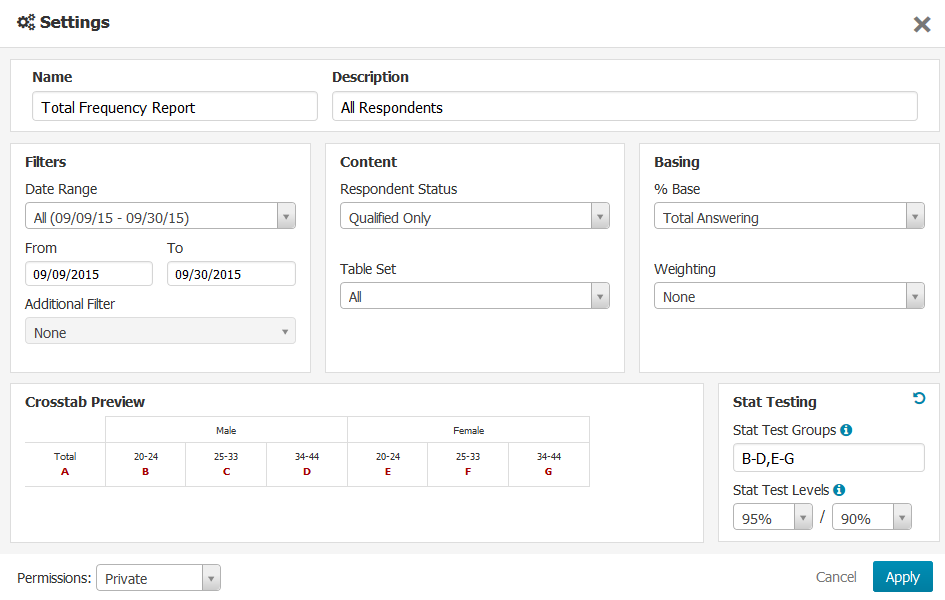
A simplified user interface allows easy data exploration and crosstab creation. Create custom segments with logic, nested banner points, filters, and add your own custom weights. Save your report settings for future use and data runs.
Our unique online crosstab tool can replace traditional offline tabs.
Data for each survey question is presented in table format. Base, counts, percentages, and stat testing is shown.
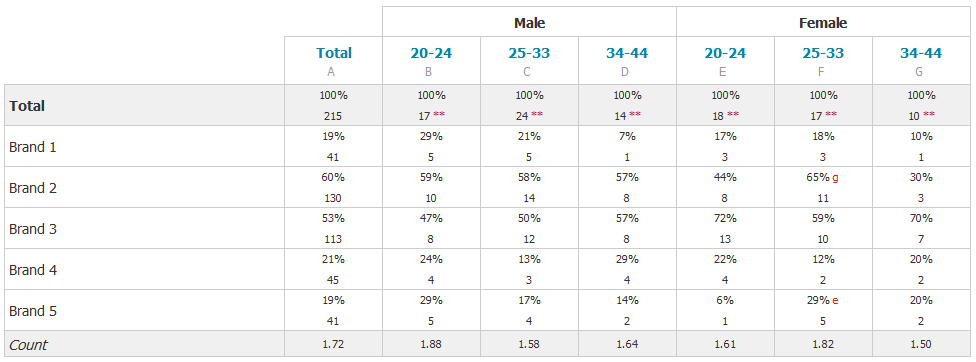
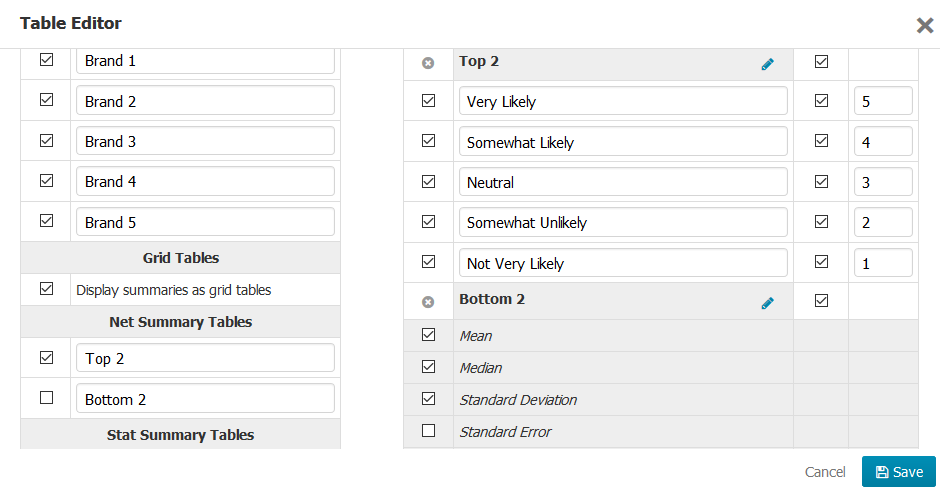
Table edits have never been easier.
Add custom NETs, remove rows, edit table text, or create summary tables. These features and more are at your fingertips.
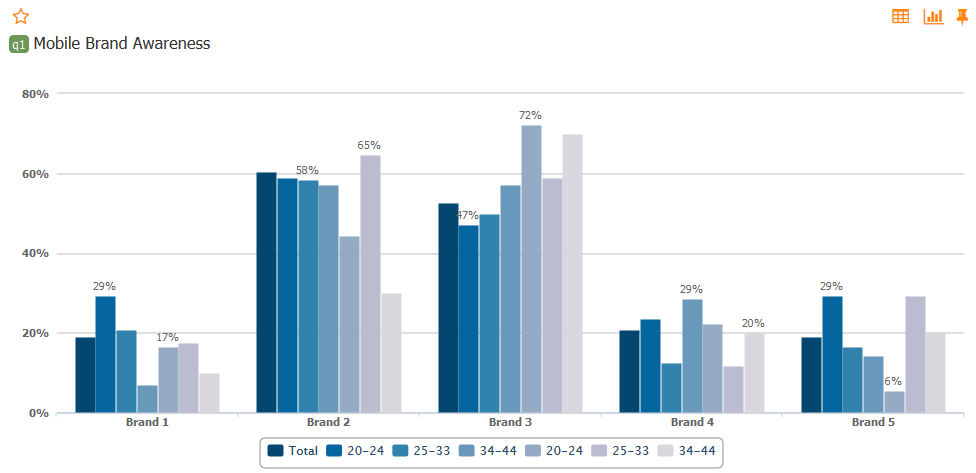
Automated charting capabilities.
Choose from line, bar, pie, or column charts to illustrate data from each question or table in an online report.
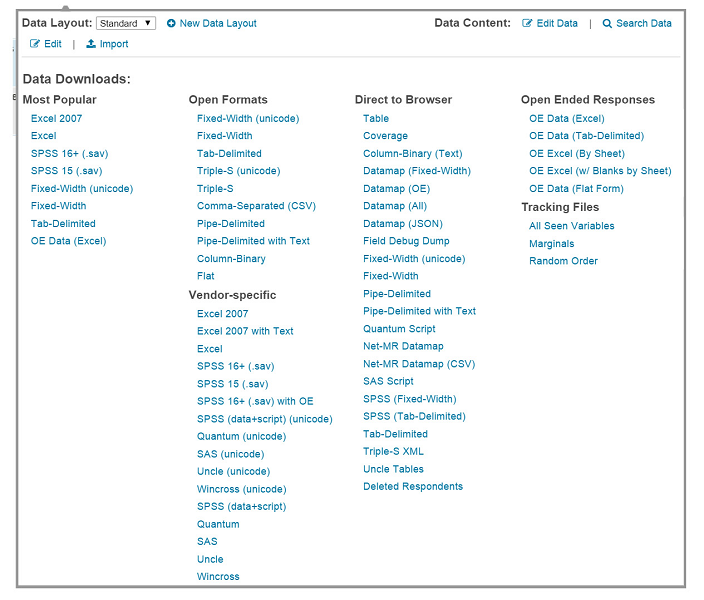
A Variety of data downloads are available to suite all of your export needs.
From Excel to SPSS; Quantum and Wincross. Need tab-delimited? We got it.